
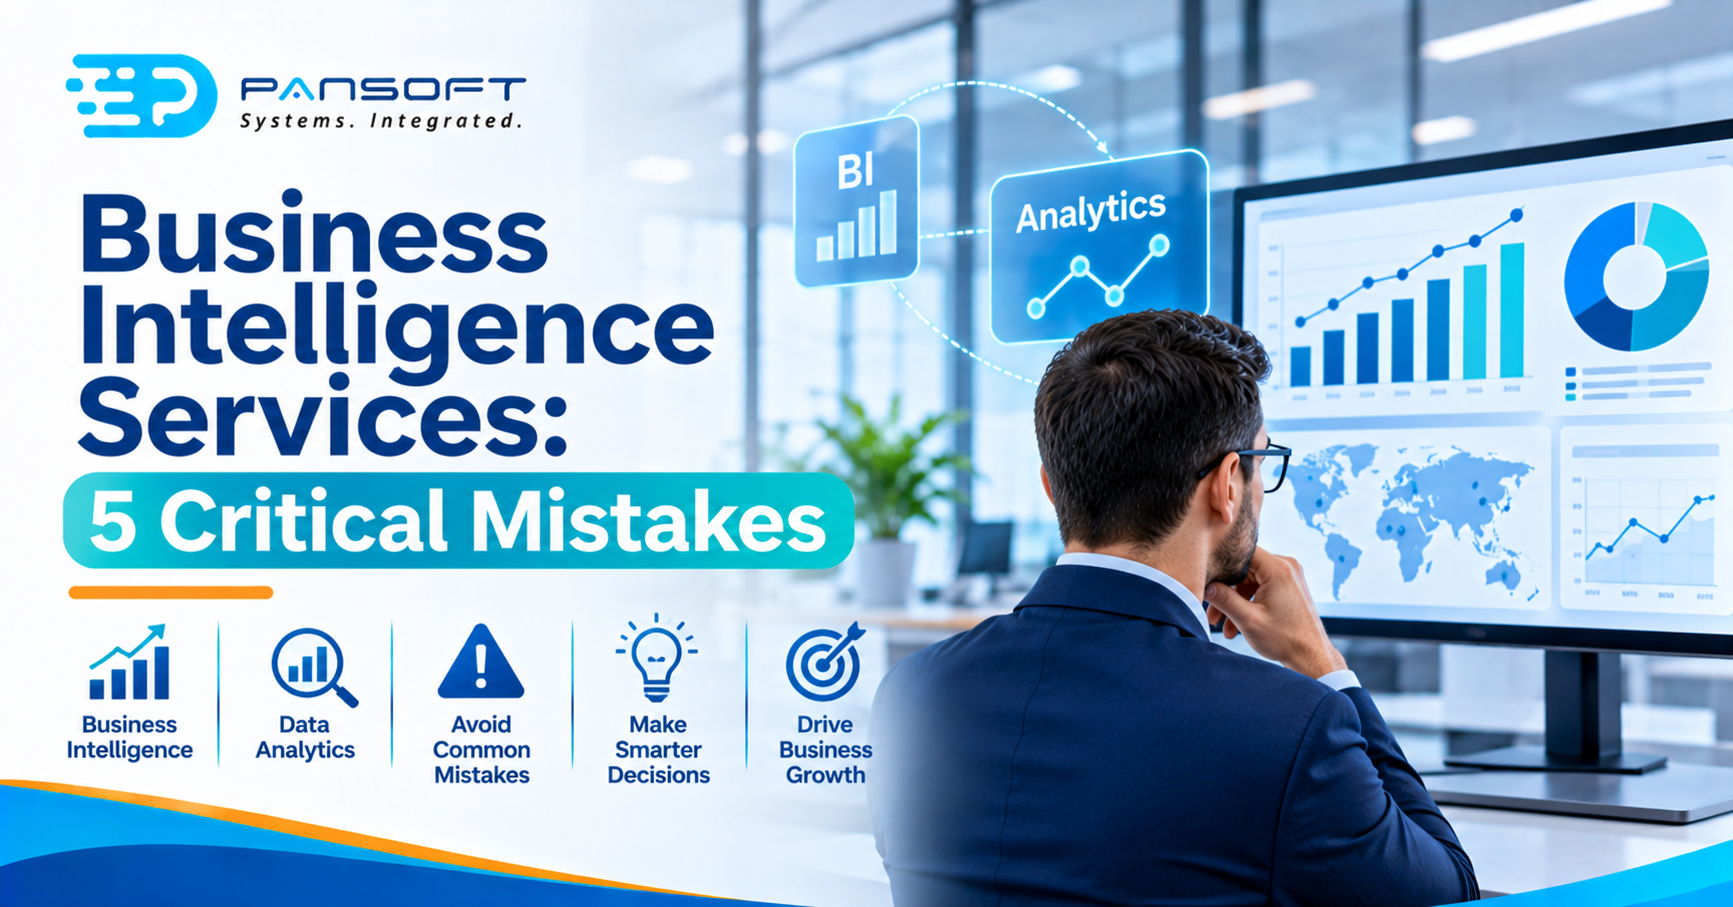
Business Intelligence Services: 5 Critical Mistakes
By the Pansoft Technologies team | Published 5 November 2026 | Last reviewed: November 2026
Business intelligence services turn your existing data into reports and dashboards that show what happened and what’s happening now. Data analytics goes further, asking why it happened and what’s likely next. The terms overlap, and vendors disagree on which one contains the other.
This is for managers and IT leads who keep hearing both terms and need to decide what to buy or build. Pansoft’s Data Analytics Services Australia page covers how we deliver both.
What is business intelligence, and how is it different from data analytics?
Business intelligence collects, stores and analyses business data to show how the business is performing, mostly through reports and dashboards. Data analytics is the wider practice of finding patterns in data, including why something happened and what comes next. In practice, BI is usually the descriptive half.
The family tree is messier than most explainers admit. Tableau’s own guide calls business analytics and data analytics subsets of BI in its opening, then describes data analytics as a broad umbrella a few paragraphs later. So skip the hierarchy and ask which question you need answered.
| Business intelligence | Data analytics | |
|---|---|---|
| Question it answers | What happened, and what’s happening now? | Why did it happen, and what’s likely next? |
| Typical techniques | Reports, dashboards, KPIs | Statistical analysis, data mining, predictive models, machine learning |
| Typical audience | Managers, executives and front-line staff | Analysts and data scientists |
| Typical output | Regular, repeatable reporting | Root-cause findings and forecasts |
Both Tableau and Fivetran land in the same place: a business needs both. Reporting tells you where to look. Analytics tells you what to do about it.
Picture a regional manager whose weekly dashboard shows sales down in one region. That’s BI doing its job. Working out whether it’s a stock problem, a competitor or a broken checkout is analytics.
What do business intelligence services actually deliver?
Mostly the plumbing and the screens. A service connects data from your ERP, CRM and finance systems, consolidates it in one place, then presents it through dashboards and reports. Fivetran’s description of BI follows the same order: collect, integrate into a single source of truth, analyse, present.
Pansoft’s data analytics page lists BI dashboards, executive reporting portals, data warehousing and data governance among its services, and its own process runs discover, integrate, analyse, visualise and optimise. Consolidation comes before the clever work, which matters for what follows.
Which five mistakes do teams make with BI and analytics?
1. Treating the two terms as interchangeable
Tableau notes people use these terms to mean a variety of things, and advises focusing less on BI versus analytics and more on what the data system needs to do and who will use it. Write your requirement as a list of questions, not a product category.
2. Expecting a dashboard to explain why
BI answers “what” and “how”, according to Tableau. The “why” belongs to analytics. Fivetran’s examples of diagnostic work, such as customer churn analysis, need someone to dig into the data and not just display it. A good dashboard at least lets readers drill into the underlying report, which is where the digging starts.
3. Reporting on data nobody has integrated
Dashboards inherit every flaw in their sources. Fivetran’s process includes consolidating data into one source of truth and cleaning out duplicates and errors before analysis. Skip that and two people will show up to a meeting with two different revenue figures.
Some records need a stronger history than a database gives. NIST describes blockchains as tamper-evident, tamper-resistant ledgers and lists supply chains and records management among possible uses. Blockchain-based records can feed reporting like any other source, though they’re a niche input and not a prerequisite.
4. Executive Dashboards that try to show everything
Microsoft’s dashboard guidance treats a dashboard as an overview, a single place to monitor the current state, and suggests keeping everything on one screen with the most important figure top left. Don’t put detail on it unless your readers need to monitor it. They can drill into the reports.
Good Data Visualisation is mostly restraint. Microsoft recommends bar and column charts for comparing values and warns against hard-to-read visuals such as 3D charts.
5. Buying prediction before the basics
Tableau says predictive analytics uses data mining, modelling and machine learning to estimate the likelihood of future outcomes. A forecast learns from your history, so a history full of duplicates produces a confident wrong answer. Get the reporting trusted first, then add prediction where a forecast would change a decision.
What should you do first?
- Write down the five questions leaders ask every month.
- Mark which are “what happened” questions and which are “why” or “what next”.
- List the systems that hold the answers, including your ERP and any cloud platforms, and who owns each.
- Build one dashboard, for one audience, on one screen.
- Add forecasting only once people trust the numbers.
Common questions
Is business intelligence part of data analytics?
It depends who you ask. Tableau calls business analytics and data analytics subsets of BI in one paragraph and describes data analytics as a broad umbrella in another. For planning, ignore the hierarchy and ask which question each tool answers, past performance or future outcomes.
Do we need business intelligence before predictive analytics?
Usually, yes. Predictive work depends on clean, consolidated data, and reporting is where data problems show up first. Pansoft’s own process consolidates data before analysing it. Skip that step and models learn from whatever mess the reports were hiding, with no trusted baseline to judge the forecast against.
What should an executive dashboard show?
Microsoft’s guidance treats a dashboard as an overview of current state, kept to one screen with the most important information top left. Include only the metrics your audience uses to make decisions, and let people drill into the underlying reports for detail.
Where to go from here
The difference between BI and analytics matters less than knowing which questions your business actually needs answered. If you’d like help sorting that out, get in touch with the Pansoft team. We can talk through your reporting, and our Business Intelligence Services build the dashboards and integration behind it, with no obligation either way.

Related Posts
Enterprise SD-WAN Platform Australia Buyers, Essential Multi-WAN Checks
Enterprise SD-WAN Platform Australia Buyers, Essential Multi-WAN Checks By the Pansoft Technologies team | Published 6 November 2026 | Last reviewed: November 2026 An enterprise…
Read More
What Is Zero-Touch Deployment? Essential Facts for Multi-Site Rollouts
What Is Zero-Touch Deployment? Essential Facts for Multi-Site Rollouts By the Pansoft Technologies team | Published 6 November 2026 | Last reviewed: November 2026 Zero-touch…
Read More