Predictive Analytics Explained, Essential Uses and Costly Limits
By the Pansoft Technologies team | Published 6 November 2026 | Last reviewed: November 2026
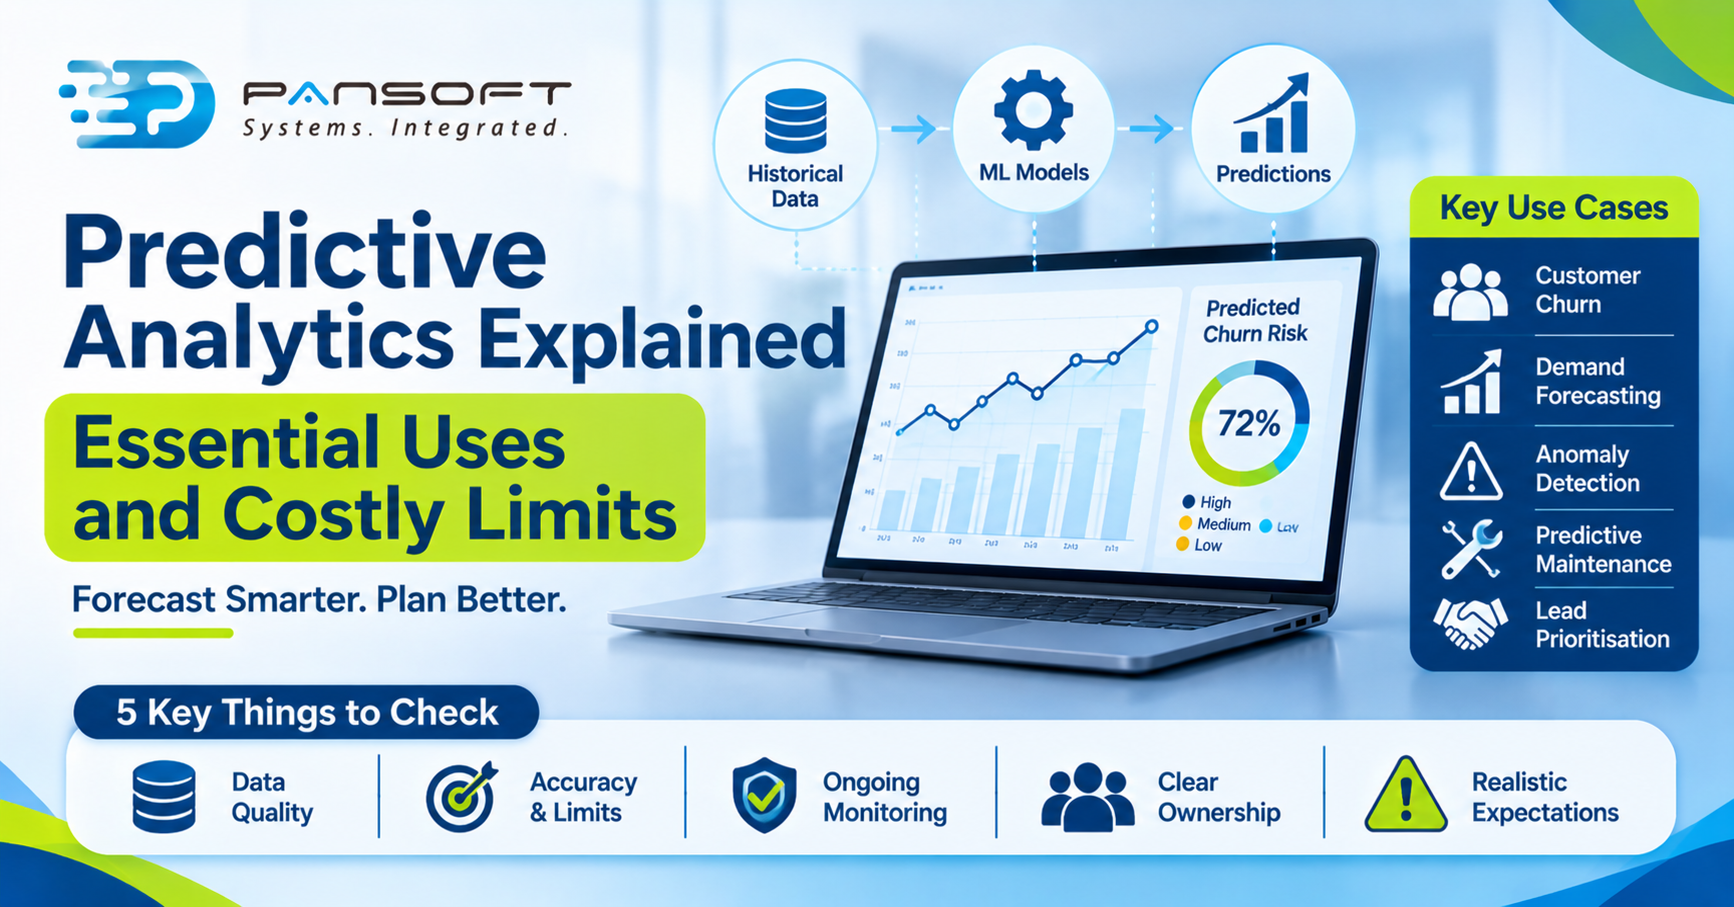
Predictive analytics uses your historical data and statistical or machine learning models to estimate what’s likely to happen next. It gives you probabilities, not certainties. It works well on stable, well-recorded patterns, and it weakens when the data is poor or the business changes.
This is for business and IT decision-makers deciding whether predictive analytics deserves funding. If you’re comparing providers of Data Analytics Services Australia, it gives you the questions to ask first, and our data analytics page covers the service side.
What is predictive analytics, and how does it work?
SAP describes predictive analytics as a branch of advanced analytics that uses historical data, statistical algorithms and machine learning to forecast future outcomes. The techniques it lists include regression, classification, time series analysis and anomaly detection.
In plain terms, you show a model past cases where you already know what happened. It learns the patterns. You then give it new cases and it estimates the likely outcome. That’s all. There’s no crystal ball in it, just arithmetic on your own records.
What can predictive analytics realistically tell you?
It can tell you how likely something is for a clearly defined question, such as which customers may leave or what demand might look like next quarter. It can’t explain why, and it can’t see events that never appear in your history.
| Question you ask | What a model can offer | What it can’t tell you |
|---|---|---|
| Which customers may leave? | A likelihood score for each customer | Why they’d leave, or whether an offer would change their mind |
| What will demand look like next quarter? | A forecast range based on past patterns | The effect of a new rule or competitor it has never seen |
| Which transactions look unusual? | Flags for a person to review | Whether each flag is genuinely a problem |
| Which equipment may fail soon? | A risk ranking from sensor readings | The exact day a part will fail |
| Which leads deserve a call first? | A priority order | That a top-ranked lead will actually buy |
The verdict: predictive analytics suits repeatable decisions with plenty of recorded history, such as demand, churn and review queues. It suits one-off strategic bets poorly, because there’s no history to learn from.
Why does predictive analytics fail in practice?
Mostly because of the data and the business around it, not the maths. SAP states that predictive analytics needs clean, complete and relevant data to provide accurate output, and warns that bias can enter through how training data is selected.
Australian Government guidance for agencies makes the same point from the public sector side. It says data quality should be assessed before use in AI systems, with minimum thresholds for measures such as accuracy, completeness and timeliness. Private firms can borrow that habit. Decide what “good enough” means before you build, not after the forecast disappoints.
Then there’s drift. The same guidance describes data drift, where input patterns change from those used in training, and concept drift, where the relationship between inputs and the thing you’re predicting changes. An independent venture firm’s write-up adds that mergers, new products, new regulations and market entry can all push a model off course.
That’s the hidden cost. A predictive model is never finished. Someone has to watch its accuracy and decide when it needs retraining or replacing.
Where do dashboards and charts fit in?
A prediction nobody sees doesn’t change a decision. dotData, a vendor of predictive tools, lists skipping the delivery step as a common mistake, noting teams often don’t plan how predictions reach users through BI dashboards or CRM systems. Treat that as one vendor’s view, though it matches what many teams report.
In our view, Executive Dashboards work best when they show the forecast next to actual results, so leaders can see whether the model is holding up. Good Data Visualisation also shows the range around a forecast, which stops a single number being read as a promise.
What does a failed forecast look like?
Here’s a hypothetical, not a client story. Picture a 150-person distributor that wants to forecast stock demand. Three years of sales sit in one system, but the promotions calendar lives in spreadsheets. The first forecast looks sound. Then a supplier changes its terms, ordering habits shift, and the model keeps predicting the old pattern. Nobody was tracking forecast error against actual sales, so the stock gap shows up as a shortage.
The fix wasn’t a cleverer model. It was joining the promotions data, tracking error weekly and agreeing who acts when it climbs.
How does predictive analytics relate to AI and blockchain?
It is one practical use of machine learning. When the problem needs heavier modelling, such as images, text or complex patterns, that’s the territory of AI and machine learning work. Start simple, though. A basic forecast on clean data often beats an ambitious model on messy data.
Blockchain isn’t a prediction method, so don’t expect it to improve a forecast. Where several organisations share records and need an agreed audit trail, enterprise blockchain use cases cover how those records are kept. The link is only that any model is limited by the records it learns from.
What should you ask a provider?
- What decision will this change? If nobody can name one, stop.
- What data do we need, and what shape is ours in? Ask for a data check before any modelling.
- How will you measure accuracy? Get the measure and the acceptable threshold agreed in writing.
- Who monitors drift after launch? A model without an owner decays quietly.
- How will the results reach people? Ask to see the dashboard, not only the model.
What are your next steps?
- Pick one repeatable decision, such as churn, demand or review queues.
- Check whether you have enough clean history for it.
- Agree the accuracy measure and the action that follows a prediction.
- Run a small pilot and compare forecasts with real results.
- Talk to a provider about the pilot, not a platform purchase.
FAQ
Is predictive analytics the same as AI?
Not exactly. Predictive analytics uses statistics and machine learning to estimate likely outcomes from past data. AI is a wider field that also covers tasks such as language and image understanding. Many predictive projects use machine learning, but a simple regression forecast doesn’t need anything fancier.
How much data do I need for predictive analytics?
There’s no universal number, and no source we checked gives one. SAP notes that too few data sources make accuracy hard to ensure, and that the data must be clean and relevant. A short data review before modelling will tell you whether your history is enough.
How accurate is predictive analytics?
It depends on the data, the question and how often you check the model. Accuracy can fall over time through drift. Agree an accuracy measure and threshold before you build, then track it against real results, rather than trusting a figure quoted in advance.
Want to talk it through?
If you’re weighing this up and aren’t sure your data is ready, get in touch. We’re happy to talk through what you have, with no pressure to commit.

Related Posts

Enterprise SD-WAN Platform Australia Buyers, Essential Multi-WAN Checks
Enterprise SD-WAN Platform Australia Buyers, Essential Multi-WAN Checks By the Pansoft Technologies team | Published 6 November 2026 | Last reviewed: November 2026 An enterprise…
Read More
What Is Zero-Touch Deployment? Essential Facts for Multi-Site Rollouts
What Is Zero-Touch Deployment? Essential Facts for Multi-Site Rollouts By the Pansoft Technologies team | Published 6 November 2026 | Last reviewed: November 2026 Zero-touch…
Read More